Workshop CIENFI — Spatial Data in R
Hands-on workshop series of ICESI's CIENFI research center: vector data with sf, rasters and night lights with terra, and satellite applications (Sentinel-2, VIIRS) in R — plus class notes and commentaries on the papers behind each application.
Instructor: Eduard F. Martínez-González
Institution: Universidad ICESI — CIENFI — Centro de Investigaciones en Economía y Finanzas
Program: Research workshop series
Term: 2025 – 2026
Original title (in Spanish): Workshop CIENFI: Introducción al Análisis de Datos Espaciales en R. All materials are in Spanish.
Hands-on workshops on spatial data in R for applied economics, built on real data from Cali — geocoded points, census blocks, night lights, and satellite imagery. Each workshop is a self-contained folder: download the zip, open the .Rproj in RStudio, and run the script from top to bottom — every path is relative, nothing needs to be edited.
workshop-N/
├── workshop-N.Rproj   ← open this file in RStudio
├── code/              ← live-coding script(s) of the session
├── data/              ← every dataset the scripts read
└── output/            ← files the scripts produce
Workshop 1 — Introducción a Datos Espaciales en R
Vector data with sf: geocoding addresses, querying OpenStreetMap, spatial filters, geodesic distances, and maps with mapview and ggplot2.
Recording Slides · part 1 Slides · part 2 Script Download (zip) Data: data_cali.rds — addresses in Cali for the geocoding exercise.
Workshop 2 — Introducción a Datos Raster en R
Raster data with terra: night lights over Colombia cropped to Cali with OSM boundaries, raster-to-vector conversion, the spatial join with census blocks, and the light–population regression.
Recording Slides (~45 MB) Script Download (zip) Data: manzanas_cali.rds (census blocks with population) · night_light_201301.tif · night_light_202301.tif (night lights, Jan 2013 and Jan 2023).
Workshop 3 — Sentinel-2 y Luces Nocturnas VIIRS
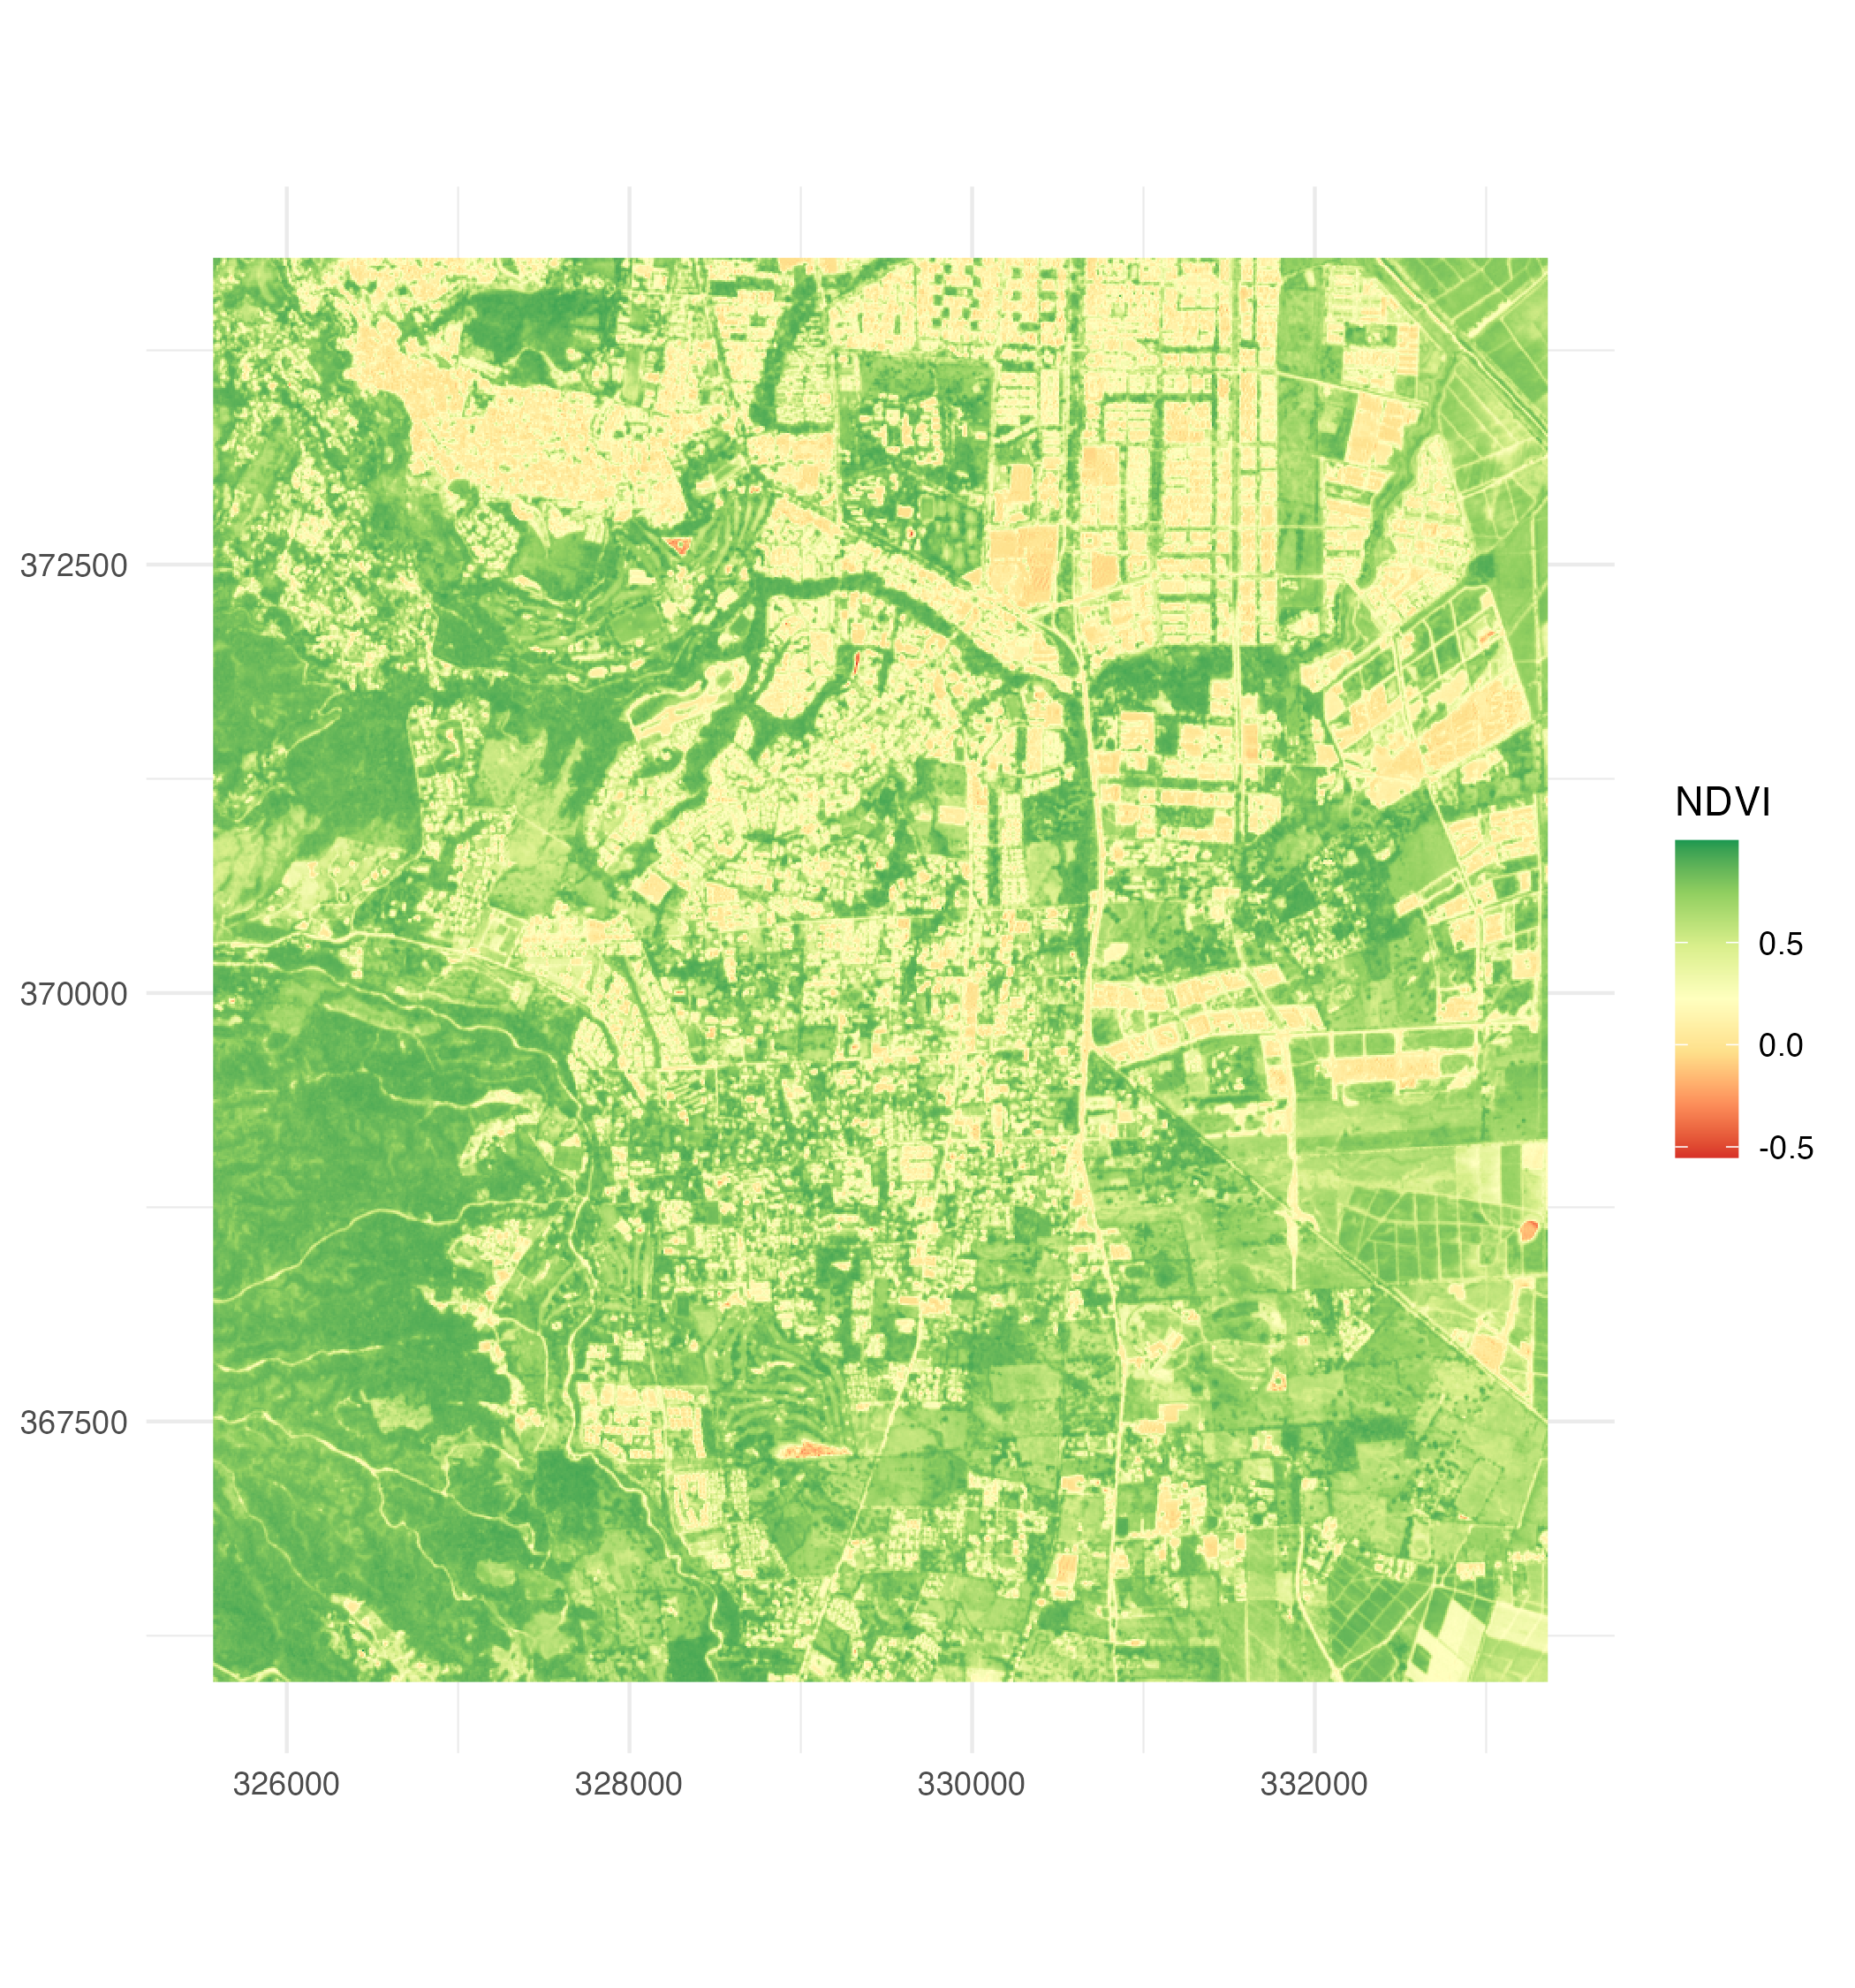
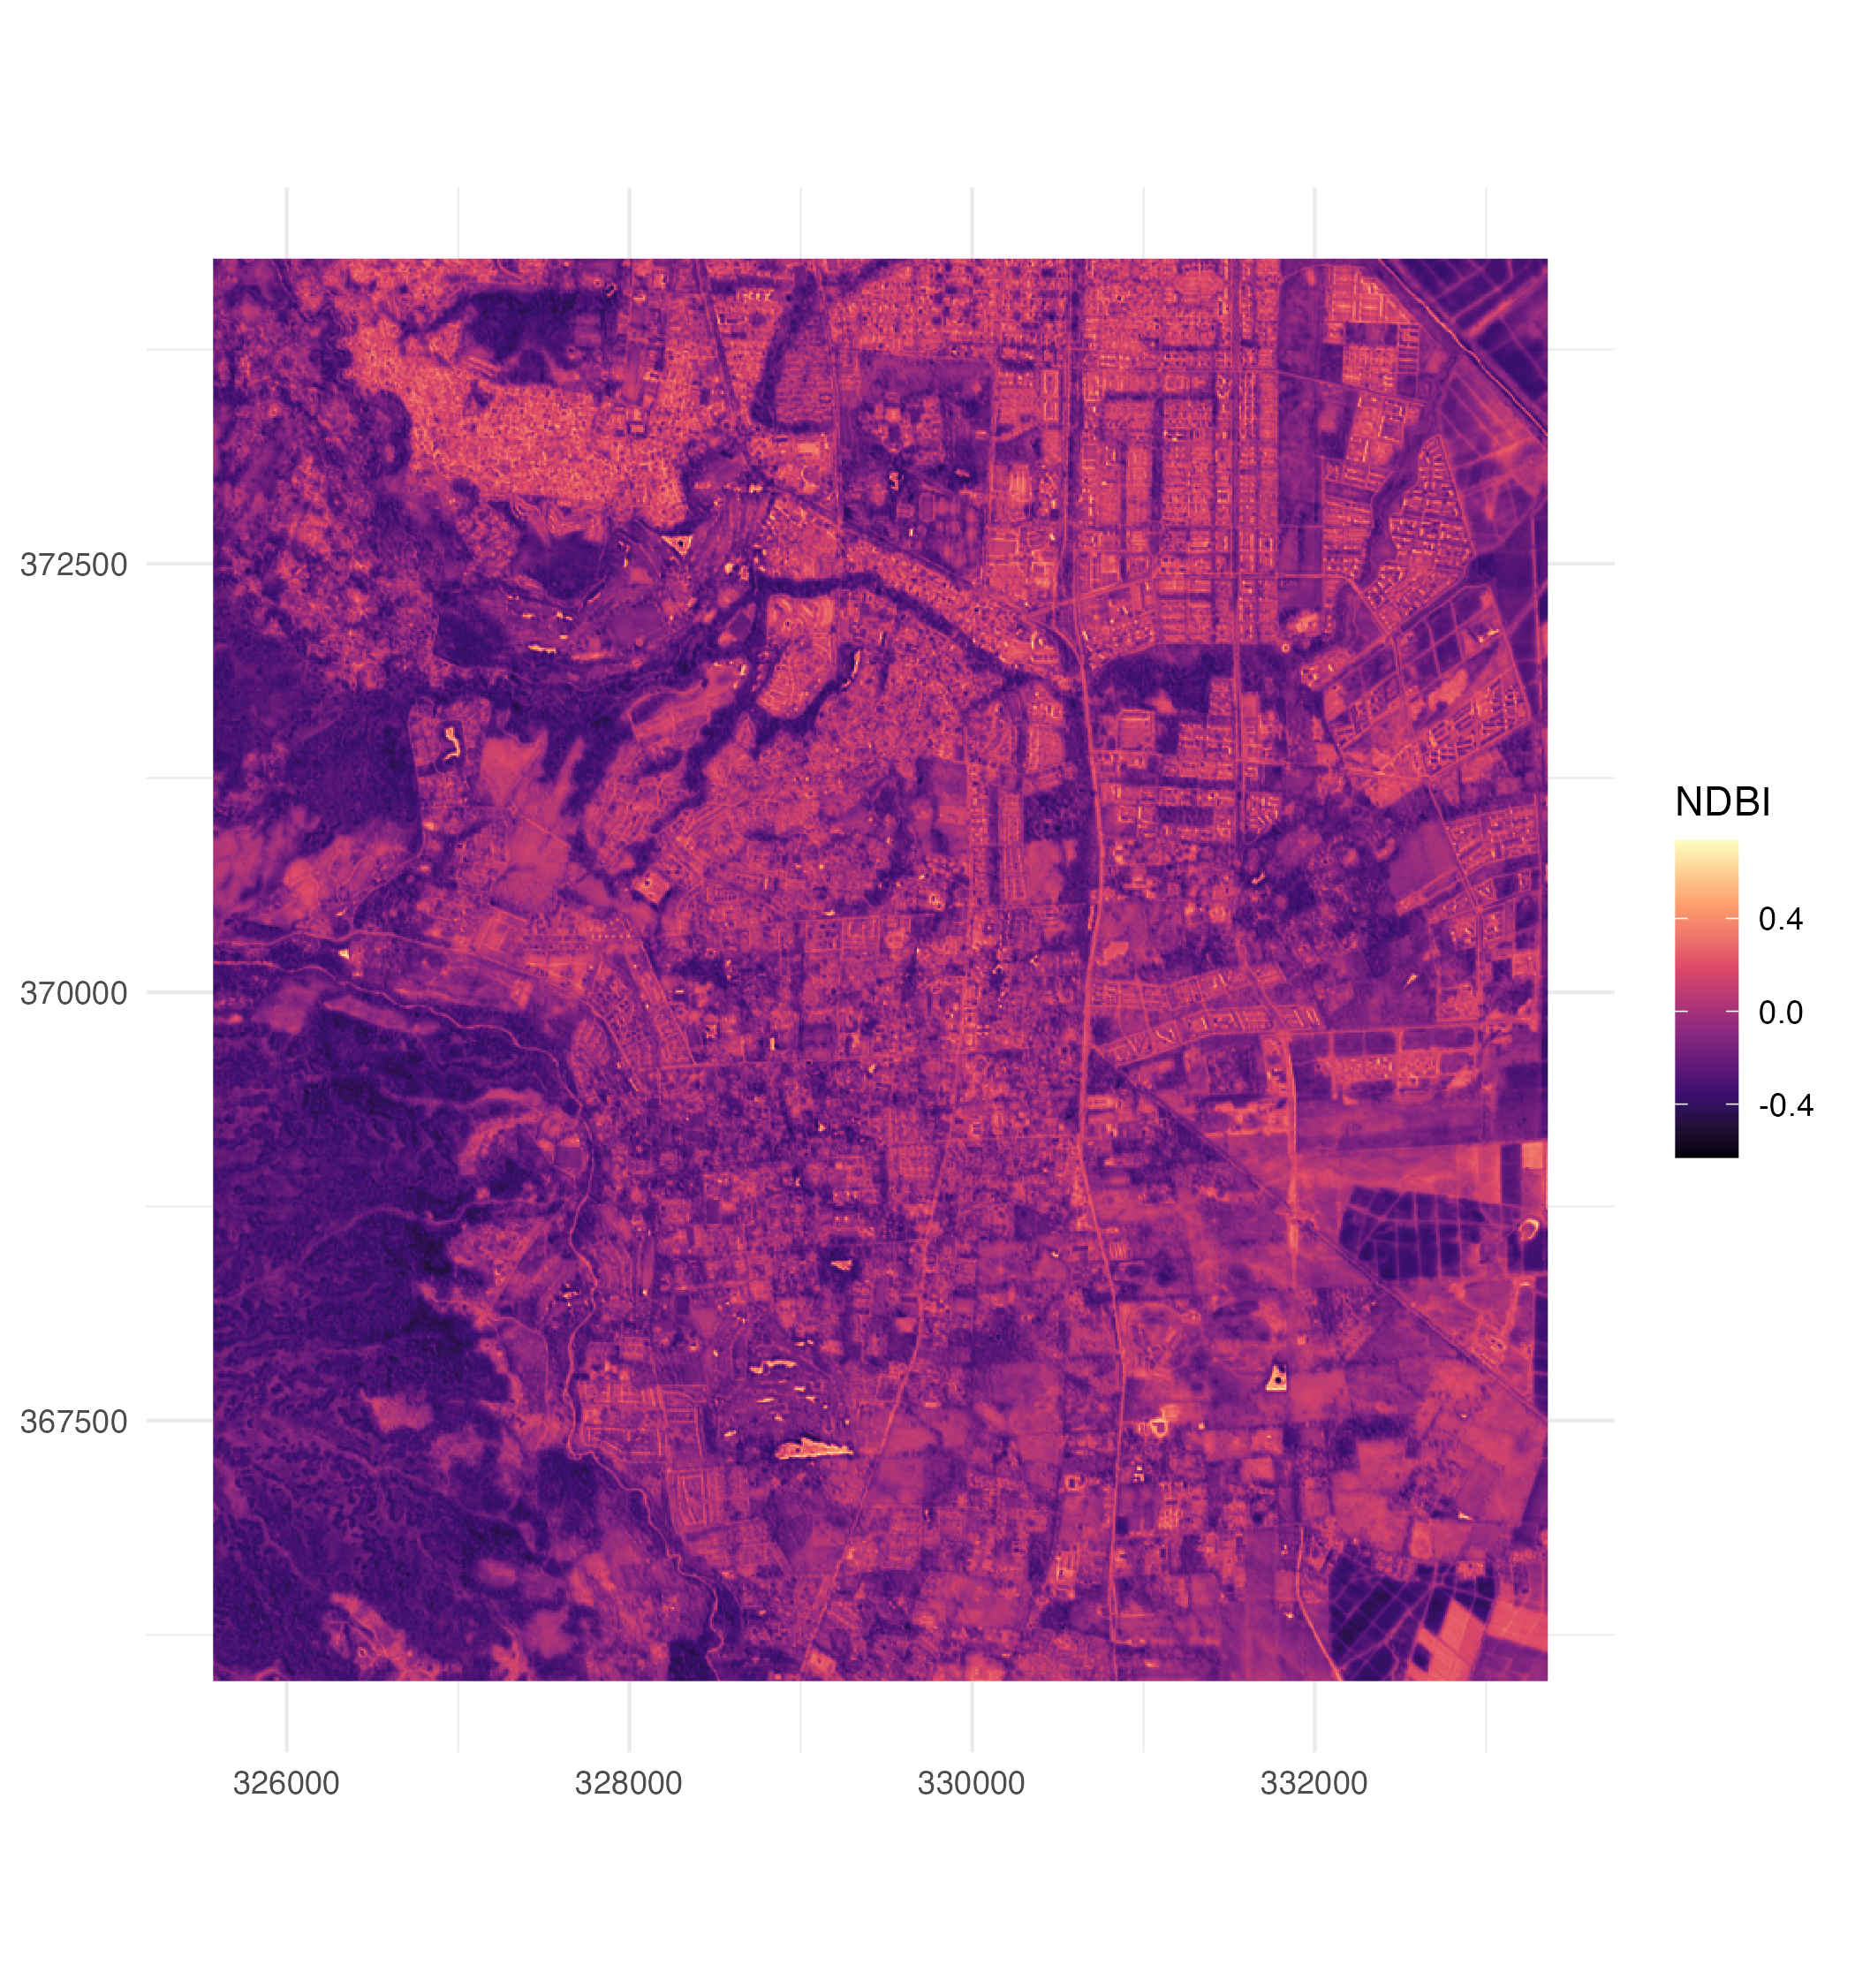
Satellite applications in two annotated, code-first scripts (no slides): band algebra on a Sentinel-2 image of southern Cali — true/false color, NDVI and NDBI — and the monthly VIIRS night-lights series (2012–2025) crossed in both directions with 19,081 Google Maps establishments.
Recording Script · part 1 Script · part 2 Download (zip) Data: sentinel_pance.tif (Sentinel-2, Aug 2024, 5 bands at 10 m) · nl_cali_viirs.tif (monthly VIIRS stack, 162 bands) · puntos_maps.rds (Google Maps establishments).
Sample outputs: NDVI map · NDBI map
Notes and documentation
Unlike the regular courses on this site, this space also collects writing: class notes, methodological explainers behind each technique, and short commentaries on the papers that motivate the applications (night lights as a proxy for economic activity, satellite indices for urban growth).
The first notes and paper summaries are in preparation and will be published here.
New workshops, notes, and paper summaries are added as the series progresses.